Saturday, June 29, 2024

Fisher Information Matrix

Target audience: Advanced
Estimated reading time: 7'
The Fisher Information Matrix plays a crucial role in various aspects of machine learning and statistics. Its primary significance lies in providing a measure of the amount of information that an observable random variable carries about an unknown parameter upon which the probability depends.


Table of contents
       Key elements
       Use cases
Follow me on LinkedIn

What you will learn: How to estimate and visualize the Fisher information matrix for Normal and Beta distributions on a hypersphere.

Notes

  • Environments: Python  3.10.10, Geomstats 2.7.0
  • This article assumes that the reader is somewhat familiar with differential and tensor calculus [ref 1]. Please refer to our previous articles related to geometric learning listed on Appendix.
  • Source code is available at  Github.com/patnicolas/Data_Exploration/Information Geometry
  • To enhance the readability of the algorithm implementations, we have omitted non-essential code elements like error checking, comments, exceptions, validation of class and method arguments, scoping qualifiers, and import statements.

Introduction

This article is the 10th installments of our ongoing series focused on geometric learning. It introduces some basic elements of information geometry as an extension of differential geometry. As with previous articles, we utilize the Geomstats Python library [ref. 2] to implement concepts associated with geometric learning. 

NoteSummaries of my earlier articles on this topic can be found in the Appendix

As a reminder, the primary goal of learning Riemannian geometry is to understand and analyze the properties of curved spaces that cannot be described adequately using Euclidean geometry alone. 

Here is a synapsis of this article
  1. Brief introduction to information geometry
  2. Overview and mathematical formulation of the Fisher information matrix
  3. Computation of the Fisher metric to Normal and Beta distributions
  4. Implementation in Python using the Geomstats library

Information geometry

Information geometry applies the principles and methods of differential geometry to problems in probability theory and statistics [ref 3]. It studies the manifold of probability distributions and provides a natural framework for understanding and analyzing statistical models.

Key elements

  • Statistical manifolds: Families of probability distributions are considered as a manifold, with each distribution representing a point on this manifold.
  • Riemannian metrics: The Fisher information metric is commonly used to define a Riemannian metric on the statistical manifold. This metric measures the amount of information that an observable random variable carries about an unknown parameter.
  • Divergence measures: Divergence measures like the Kullback-Leibler (KL) divergence, which quantify the difference between two probability distributions.
  • Connections and curvature: Differential geometry concepts such as affine connections and curvature are used to describe the geometric properties of statistical models (i.e. α-connection family).
  • Dualistic inference: Exponential and mixture connections provide a rich structure for statistical inference.

Use cases

Here is a non-exclusive list of application of information geometry
  • Statistical Inference: Parameter estimation, hypothesis testing, and model selection (i.e. Bayesian posterior distributions and in the development of efficient sampling algorithms like Hamiltonian Monte Carlo)
  • Optimization: Natural gradient descent method uses the Fisher information matrix to adjust the learning rate dynamically, leading to faster convergence compared to traditional gradient descent.
  • Finance: Modeling uncertainties and analyzing statistical properties of financial models.
  • Machine Learning: Optimization of learning algorithms (i.e. Understanding the EM algorithm used in statistical estimation for latent variable model)
  • Neuroscience: Neural coding and information processing in the brain by modeling neural responses as probability distributions.
  • Robotics: Development of probabilistic robotics, where uncertainty and sensor noise are modeled using probability distributions.
  • Information Theory: Concepts for encoding, compression, and transmission of information.

Fisher information matrix

The Fisher information matrix is a type of Riemannian metric that can be applied to a smooth statistical manifold [ref 4]. It serves to quantify the informational difference between measurements. The points on this manifold represent probability measures defined within a Euclidean probability space, such as the Normal distribution. Mathematically, it is represented by the Hessian of the Kullback-Leibler divergence.

Let's consider a statistical manifold with coordinates (or parameters) θ and its probability density functions over an interval X as follow:\[P= \left \{ p(x, \theta); \ x \in X \ \int_{R}^{} p(x, \theta) dx = 1\right \}\]The Fisher metric is a Riemann metric tensor defined as the expectation of the partial derivative of the negative log likelihood over two coordinates θ.\[g_{ij}(\theta) = -E\left [ \frac{\partial^2\ log\ p(x,\theta) }{\partial \theta_{i}\partial\theta_{j}} \right ] = - \int_{R}^{}{\frac{\partial^2\ log\ p(x,\theta)) }{\partial \theta_{i}\partial\theta_{j}}}p(x, \theta)dx\]

The Fisher information or Fisher-Rao metric quantifies the amount of information in the data regarding a parameter θ. The Fisher-Rao metric, an intrinsic measure, enables the analysis of a finite, n-dimensional statistical manifold M.\[ds=\sum_{i=1}^{p}{\sum_{j=1}^{p}}g_{ij}\theta^{i}\theta^{j}\]
The Fisher metric for the normal distribution θ = {μ, σ} is computed as:\[\mathfrak{I}(\mu, \sigma)=-\textit{E}_{x-p}\begin{bmatrix} \frac{\partial ^2\ log\ p(\theta)}{\partial \mu^2} & \frac{\partial ^2\ log\ p(\theta)}{\partial \mu \partial \sigma} \\ \frac{\partial ^2\ log\ p(\theta)}{\partial \sigma \partial \mu} & \frac{\partial ^2\ log\ p(\theta)}{\partial \sigma^2} \end{bmatrix} = \begin{bmatrix} \sigma^{-2} & 0\\ 0 & 2\sigma^{-2} \end{bmatrix}\]
The Fisher metric for the beta distribution  θ = {α, β} is computed as:\[\varphi (z)=\frac{d^2}{dz^2}\ log \ \Gamma (z)\]
\[\mathfrak{I(\alpha,\beta)}=-\textit{E}_{x-p}\begin{bmatrix} \frac{\partial ^2\ log\ p(\theta)}{\partial \alpha^2} & \frac{\partial ^2\ log\ p(\theta)}{\partial \alpha \partial \beta} \\ \frac{\partial ^2\ log\ p(\theta)}{\partial \beta \partial \alpha} & \frac{\partial ^2\ log\ p(\theta)}{\partial \beta^2} \end{bmatrix}\]
\[\mathfrak{I(\alpha,\beta)}=\begin{bmatrix} \varphi(\alpha)-\varphi(\alpha+\beta) & -\varphi(\alpha+\beta)\\ -\varphi(\alpha+\beta) & \varphi(\beta)-\varphi(\alpha+\beta) \end{bmatrix}\]

Implementation

We leverage the following classes defined in the previous articles:
Let's first define a base class for all distributions to be defined on a hypersphere [ref 5].

class GeometricDistribution(object):
    _ZERO_TGT_VECTOR = [0.0, 0.0, 0.0]

    def __init__(self) -> None:
        self.manifold = HypersphereSpace(True)


    def show_points(self, num_pts: int, tgt_vector: List[float] = _ZERO_TGT_VECTOR) -> NoReturn:
        # Random point generated on the hypersphere
        manifold_pts = self._random_manifold_points(num_pts, tgt_vector)
        
        # Exponential map used to project the tgt vector on the hypersphere
        exp_map = self.manifold.tangent_vectors(manifold_pts)

        for v, end_pt in exp_map:
            print(f'Tangent vector: {v} End point: {end_pt}')
        self.manifold.show_manifold(manifold_pts)

The purpose of the method show_points is to display the various data point with optional tangent vector on the hypersphere. The argument num_pts specifies the number of random points to be defined in the hypersphere. The tangent vector is displayed if the argument tgt_vector not defined as the origin (_ZERO_TGT_VECTOR).


Normal distribution

The class NormalHypersphere encapsulates the display of the normal distribution on the hypersphere. The constructor initialized the normal distribution implemented in the Geomstats library.
The method show_distribution display num_pdfs probability density function over a set of num_manifold_pts, manifold points on the hypersphere. This specific implementation uses only two points. The Fisher-Rao metric is computed using the metric.geodesic Geomstats method.
The metric is applied to 100 points along the geodesic between the two points A and B. Finally, the density functions, pdfs are computed by converting the metric values to the NormalDistribution.point_to_pdf Geomstats method.

class NormalHypersphere(GeometricDistribution):

    def __init__(self) -> None:
        from geomstats.information_geometry.normal import NormalDistributions

        super(NormalHypersphere, self).__init__()
        self.normal = NormalDistributions(sample_dim=1)


    def show_distribution(self, num_pdfs: int, num_manifold_pts: int) -> NoReturn:
        manifold_pts = self._random_manifold_points(num_manifold_pts)
        A = manifold_pts[0]
        B = manifold_pts[1]

        # Apply the Fisher metric for the two manifold points on a Hypersphere
        geodesic_ab_fisher = self.normal.metric.geodesic(A.location, B.location)
        t = gs.linspace(0, 1, 100)

        # Generate the various density functions associated to the Fisher metric between the
        # two points on the hypersphere
        pdfs = self.normal.point_to_pdf(geodesic_ab_fisher(t))
        x = gs.linspace(0.2, 0.7, num_pdfs)

        for i in range(num_pdfs):
            plt.plot(x, pdfs(x)[i, :]/20.0)   # Normalization factor
        plt.title(f'Normal distribution on Hypersphere')
        plt.show()

Let's plot 2 randomly sampled data points associated with a tangent_vector on Hypersphere (1) then visualize 40 normalized normal probability density distributions (2).

normal_dist = NormalHypersphere()
num_points = 2
tangent_vector = [0.4, 0.7, 0.2]

         # 1. Display the 2 data points on the hypersphere
num_manifold_pts = normal_dist.show_points(num_points, tangent_vector)

        # 2. Visualize the 40 normal probabilities density functions
num_pdfs = 40
succeeded = normal_dist.show_distribution(num_pdfs, num_points)

Fig. 1 Two random data points on a Hypersphere with their tangent vectors 


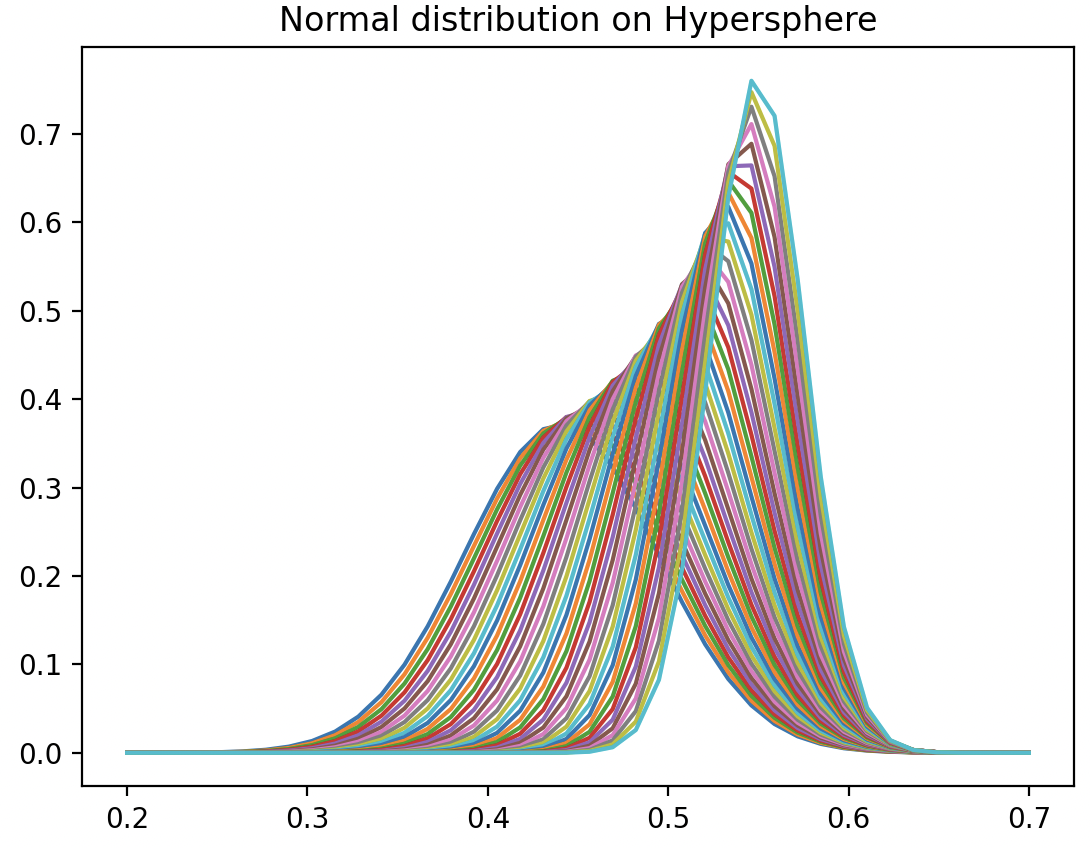
Fig. 2 Visualization of Normal distribution between two random points on a hypersphere


Beta distribution

Let's wrap the evaluation of the Beta distribution on a hypersphere into the class BetaHypersphere that inherits GeometriDistribution. It leverages the BetaDistributions class in Geomstats. 

class BetaHypersphere(GeometricDistribution):

    def __init__(self) -> None:
        from geomstats.information_geometry.beta import BetaDistributions

        super(BetaHypersphere, self).__init__()
        self.beta = BetaDistributions()


    def show_distribution(self, num_manifold_pts: int, num_interpolations: int) -> NoReturn:

        # 1. Generate random points on Hypersphere using Von Mises algorithm
        manifold_pts = self._random_manifold_points(num_manifold_pts)
        t = gs.linspace(0, 1.1, num_interpolations)[1:]
        # 2. Define the beta pdfs associated with each
        beta_values_pdfs = [self.beta.point_to_pdf(manifold_pt.location)(t) for manifold_pt in manifold_pts]

        # 3. Generate, normalize and display each Beta distribution
        for beta_values in beta_values_pdfs:
            min_beta = min(beta_values)
            delta_beta = max(beta_values) - min_beta
            y = [(beta_value - min_beta)/delta_beta  for beta_value in beta_values]
            plt.plot(t, y)
        plt.title(f'Beta distribution on Hypersphere')
        plt.show()


The method show_distribution generates random points on the Hypersphere (1)  and compute the beta density function at these points using the Geomstats BetaDistributions.point_to_pdf (2).
The values generated by the pdfs are normalized then plotted (3)


Let's plot 10 randomly sampled data points on Hypersphere (1) then visualize 200 normalized beta probability density distributions (2).

beta_dist = BetaHypersphere()
        
num_interpolations = 200
num_manifold_pts = 10
    # 1. Display the 10 data points on the hypersphere
beta_dist.show_points(num_manifold_pts)

   # 2. Visualize the probabilities density functions with interpolation points
succeeded = beta_dist.show_distribution(num_manifold_pts, num_interpolations)
Fig. 3  10 random data points with on a Hypersphere


Fig. 4 Visualization of Beta distributions associated with 10 data points on hypersphere


References


--------------------------------------
Patrick Nicolas has over 25 years of experience in software and data engineering, architecture design and end-to-end deployment and support with extensive knowledge in machine learning. 
He has been director of data engineering at Aideo Technologies since 2017 and he is the author of "Scala for Machine Learning", Packt Publishing ISBN 978-1-78712-238-3 
and Geometric Learning in Python Newsletter on LinkedIn.

Appendix

Here is the list of published articles related to geometric learning:

Wednesday, June 12, 2024

Principal Geodesic Analysis

Target audience: Advanced
Estimated reading time: 7'

Principal Component Analysis (PCA) is essential for dimensionality and noise reduction, feature extraction, and anomaly detection. However, its effectiveness is limited by the strong assumption of linearity. 
Principal Geodesic Analysis (PGA) addresses this limitation by extending PCA to handle non-linear data that lies on a lower-dimensional manifold.


Table of contents
       Tangent PCA
       Setup
       Euclidean PCA
Follow me on LinkedIn

What you will learn: How to implement principal geodesic analysis as extension of principal components analysis on a manifolds tangent space.

Notes

  • Environments: Python  3.10.10, Geomstats 2.7.0, Scikit-learn 1.4.2
  • This article assumes that the reader is somewhat familiar with differential and tensor calculus [ref 1]. Please refer to our previous articles related to geometric learning [ref 234].
  • Source code is available at  Github.com/patnicolas/Data_Exploration/manifolds
  • To enhance the readability of the algorithm implementations, we have omitted non-essential code elements like error checking, comments, exceptions, validation of class and method arguments, scoping qualifiers, and import statements.

Introduction

This article is the ninth installments of our ongoing series focused on geometric learning. As with previous articles, we utilize the Geomstats Python library [ref5] to implement concepts associated with geometric learning.

NoteSummaries of my earlier articles on this topic can be found in the Appendix

As a reminder, the primary goal of learning Riemannian geometry is to understand and analyze the properties of curved spaces that cannot be described adequately using Euclidean geometry alone. 

This article revisits the widely used unsupervised learning technique, Principal Component Analysis (PCA), and its counterpart in non-Euclidean space, Principal Geodesic Analysis (PGA).
The content of this article is as follows:
  1. Brief recap of PCA
  2. Overview of key components of differential geometry
  3. Introduction to PCA on tangent space using the logarithmic map
  4. Implementation in Python using the Geomstats library

   Principal components

    Principal component analysis

Principal Component Analysis (PCA) is a technique for reducing the dimensionality of a large dataset, simplifying it into a smaller set of components while preserving important patterns and trends. The goal is to reduce the number of variables of a data set, while preserving as much information as possible.

For a n-dimensional data, PCA tries to put maximum possible information in the first component c0, then maximum remaining information in the second c1 and so on, until having something like shown in the scree plot below.
Finally, we select the p << n top first components such as:\[\left \{ c_{i} :\ \ \sum_{i=1}^{p} c_{i} < T \ and \ \ c_{1} \geqslant c_{2} .... \geqslant c_{p} \right \}\]
The principal components are actually the eigenvectors of the Covariance matrix.
The first thing to understand about eigenvectors and eigenvalues is that they always appear in pairs, with each eigenvector corresponding to an eigenvalue. Additionally, the number of these pairs matches the number of dimensions in the data.

For instance, in a 3-dimension space, the eigenvalues are extracted from the following 3x3 symmetric Covariance matrix:\[\begin{bmatrix} cov(x, x)) & cov(x,y) & cov(x, z)\\ cov(x, y) & cov(y,y) & cov(y,z) \\ cov(x, z) & cov(y, z) & cov(z, z) \end{bmatrix}\] as cov(a, b) = cov(b, a).
The eigenvectors of the Covariance matrix (principal components) are the directions of the axes where there is the most variance (most information).
Assuming n normalized data points xi, the first principal component (with most significant eigenvalue) is defined as: \[P_{1}= arg\max_{||p||=1} \sum_{i=1}^{n} \left ( p.x_{i} \right )^{2} \ \ \ (1)\]where '.' is the dot product.


Differential geometry

Extending principal components to differentiable manifolds requires basic knowledge of differential and Riemann geometry introduced in previous articles [ref  2, 3, 4].

Smooth manifold
A smooth (or differentiable) manifold is a topological manifold equipped with a globally defined differential structure. Locally, any topological manifold can be endowed with a differential structure by applying the homeomorphisms from its atlas and the standard differential structure of a vector space.

Tangent space
At every point P on a differentiable manifold, one can associate a tangent space, which is a real vector space that intuitively encompasses all the possible directions in which one can move tangentially through P. The elements within this tangent space at P are referred to as the tangent vectors, tgt_vector at P
This concept generalizes the idea of a vector originating from a specific point in Euclidean space. For a connected manifold, the dimension of the tangent space at any point is identical to the dimension of the manifold itself.

Geodesics
Geodesics are curves on a surface that only turn as necessary to remain on the surface, without deviating sideways. They generalize the concept of a "straight line" from a plane to a surface, representing the shortest path between two points on that surface.
Mathematically, a curve c(t) on a surface S is a geodesic if at each point c(t), the acceleration is zero or parallel to the normal vector:\[\frac{d^{2}}{dt^{2}}c(t) = 0 \ \ or \ \ \frac{d^{2}}{dt^{2}}c(t).\vec{n}=\frac{d^{2}}{dt^{2}}c(t)\]
Fig. 1 Illustration of a tangent vector and geodesic on a sphere

Logarithmic map
Given two points P and Q on a manifold, the vector on the tangent space v from P to Q is defined as: \[\left \| log_{P}(Q) \right \| = \left \| v \right \|\]

Tangent PCA

On a manifold, tangent spaces (or plane) are local euclidean space for which PCA can be computed. The purpose of Principal Geodesic Analysis is to project the principal components on the geodesic using the logarithmic map (inverse exponential map).
Given a mean m of n data points x[i] on a manifold with a set of geodesics at m, geod, the first principal component on geodesics is defined as:\[\begin{matrix} P_{1}=arg\max_{\left \| v \right \| = 1}\sum_{i=1}^{n}\left \langle v.log_{m}\pi _{geod}(x_{i}) \right \rangle^{2} \\ \pi_{geod}(x_{i}) = arg\max_{g \in geod} \left \| log_{m}(x_{i})-log_{m}(g) \right \|^2 \end{matrix}\]
Fig. 2 Illustration of a tangent vector and geodesic on a sphere

The mean point on the data point x[I] on the manifold can be defined as either a barycenter or a Frechet Mean [ref 6]. Our implementation in the next section relies on the Frechet mean.

  Implementation

For the sake of simplicity, we illustrate the concept of applying PCA on manifold geodesics using a simple manifold, Hypersphere we introduced in a previous article, Differentiable Manifolds for Geometric Learning: Hypersphere

    Setup

Let's encapsulate the evaluation of principal geodesics analysis in a class HyperspherePCA. We leverage the class HyperphereSpace [ref 7] its implementation of random generation of data points on the sphere.

ff from manifolds.hyperspherespace import HypersphereSpace
I   import numpy as np

  
    class HyperspherePCA(object):
  def __init__(self):
     self.hypersphere_space = HypersphereSpace(equip=True)

  def sample(self, num_samples: int) -> np.array:
     return self.hypersphere_space.sample(num_samples)


    Euclidean PCA

First let's implement the traditional PCA algorithm for 3 dimension (features) data set using scikit-learn library with two methods:
  • euclidean_pca_components to extract the 3 eigenvectors along the 3 eigenvalues
  • euclidean_pca_transform to project the evaluation data onto 3 directions defined by the eigenvectors.
    from sklearn.decomposition import PCA

   
    @staticmethod
    def euclidean_pca_components(data: np.array) -> (np.array, np.array):
   num_components = 3
   pca = PCA(num_components)
   pca.fit(data)
   return (pca.singular_values_, pca.components_)

    @staticmethod
    def euclidean_pca_transform(data: np.array) -> np.array:
   num_components = 3
   pca = PCA(num_components)
 
        return pca.fit_transform(data

We compute the principal components on 256 random 3D data points on the hypersphere.

nu num_samples = 256
pca_hypersphere = HyperspherePCA()

# Random data on Hypersphere
data = pca_hypersphere.sample(num_samples)
eigenvalues, components = HyperspherePCA.euclidean_pca_components(data)
transformed = pca_hypersphere.euclidean_pca_transform(data)        

print(f'\nPrincipal components:\n{components}\nEigen values: {eigenvalues')
print(f'\nTransformed data:\n{transformed}')

Output
Principal components:
[[ 0.63124842 -0.7752775  -0.02168467]
 [ 0.68247094  0.54196625  0.49041411]
 [ 0.36845467  0.32437229 -0.8712197 ]]
Eigen values: [9.84728751 9.0183337  8.65835924]

Important note: The 3 eigenvalues are similar because the input data is random.

    Tangent PCA on hypersphere 

The private method __tangent_pca computes principal components on the tangent plane using the logarithmic map. As detailed in the previous section, this implementation employs the Frechet mean as the base point on the manifold, which is the argument of the Geomstats method fit.

The method tangent_pca_components extracts the principal components computed using the logarithmic map. Finally the method tangent_pca_transform projects input data along the 3 principal components, similarly to its Euclidean counterpart, euclidean_pca_transform .

   from geomstats.learning.pca import TangentPCA
from geomstats.learning.frechet_mean import FrechetMean


def tangent_pca_components(self, data: np.array) -> np.array:
    tgt_pca = self.__tangent_pca(data)
    return tgt_pca.components_

def tangent_pca_transform(self, data: np.array) -> np.array:
    tgt_pca = self.__tangent_pca(data)
    tgt_pca.transform(data)

    
def __tangent_pca(self, data: np.array) -> TangentPCA:
     sphere = self.hypersphere_space.space
     tgt_pca = TangentPCA(sphere)
       
          # We use the Frechet mean as center of data points on the hypersphere
     mean = FrechetMean(sphere, method="default")
     mean.fit(data)
          # Frechet mean estimate
     estimate = mean.estimate_
        
          # Invoke Geomstats fitting method for PCA on tangent plane
          tgt_pca.fit(data, base_point=estimate)
     return tgt_pca

    We evaluate the principal geodesic components on hypersphere using the same 256 points randomly generated on the hypersphere and compared with the components on the Euclidean space.

nu  num_samples = 256
pca_hypersphere = HyperspherePCA()
        
# Random data point generated on Hypersphere
data = pca_hypersphere.sample(num_samples)
        
_, components = HyperspherePCA.euclidean_pca_components(data)
tangent_components = pca_hypersphere.tangent_pca_components(data)
print(f'\nEuclidean PCA components:\n{components}\nTangent Space PCA components:\n{tangent_components}')

Output:
Euclidean PCA components:
[[ 0.63124842 -0.7752775  -0.02168467]
 [ 0.68247094  0.54196625  0.49041411]
 [ 0.36845467  0.32437229 -0.8712197 ]]
Tangent Space PCA components:
[[ 0.8202982  -0.45814582  0.34236423]
 [ 0.45806882  0.16783651 -0.87292832]
 [-0.34246724 -0.87288792 -0.34753831]]

References


--------------------------------------
Patrick Nicolas has over 25 years of experience in software and data engineering, architecture design and end-to-end deployment and support with extensive knowledge in machine learning. 
He has been director of data engineering at Aideo Technologies since 2017 and he is the author of "Scala for Machine Learning", Packt Publishing ISBN 978-1-78712-238-3 
and Geometric Learning in Python Newsletter on LinkedIn.

Appendix

Here is the list of published articles related to geometric learning: