Sunday, March 31, 2024

Geometric Learning in Python: Vector & Covector Fields

Target audience: Beginner
Estimated reading time: 5'

The use of Riemannian manifolds and topological computing is gaining traction in machine learning circles to surpass the existing constraints of data analysis within Euclidean space. 

This article aims to present one of the fundamental aspects of differential geometry: vector and covector fields.


Table of contents

        SymPy library
        Overview
        Implementation
Follow me on LinkedIn

What you will learn: Vector and covector fields in differential geometry applied to machine learning with implementation in 2D and 3D dimensional use cases.

Notes
  • Environments: Python  3.10.10 and SymPy 1.12
  • This article assumes that the reader is familiar with differential calculus and basic concept of geometry.
  • Source code is available at github.com/patnicolas/Data_Exploration/diffgeometry
  • To enhance the readability of the algorithm implementations, we have omitted non-essential code elements like error checking, comments, exceptions, validation of class and method arguments, scoping qualifiers, and import statements.

Introduction

The heavy dependence on elements from Euclidean space for data analysis and pattern recognition in machine learning might be approaching a threshold. Incorporating differential geometry and Riemannian manifolds has already shown beneficial effects on the accuracy of deep learning models, as well as on reducing their development costs [ref 1]. 

This article is the 4th installment in our series on Geometric Learning in Python following

Differential geometry

Conventional approaches in machine learning, pattern recognition, and data analysis often presuppose that input data can be effectively represented using elements from Euclidean space. Although this assumption has been sufficient for numerous applications in the past, there's a growing awareness among data scientists and engineers that most data in vision and pattern recognition reside in a differential manifold (feature space) that's embedded within the raw data's Euclidean space. 
Leveraging this geometric information can result in a more precise representation of the data's inherent structure, leading to improved algorithms and enhanced performance in real-world applications [ref 2].


SymPy library

SymPy is a Python library dedicated to symbolic mathematics. Its implementation is as simple as possible to be comprehensible and easily extensible. It is licensed under BSD. SymPy supports differential and integral calculus, Matrix operations, algebraic and polynomial equations, differential geometry, probability distributions, 3D plotting and discrete math [ref 3].

Vector vs. vector field

A vector and a vector field are both involving vectors, but they have different meanings:
  • Vector: A vector is a mathematical object that represents a quantity with both magnitude and direction. In physics and geometry, vectors are often represented by arrows, where the length of the arrow corresponds to the magnitude of the vector and the direction of the arrow indicates the direction of the vector. Vectors can exist in various dimensions (such as 2D, 3D, or higher dimensions)
  • Vector FieldA vector field is a function that assigns a vector to each point in each space. In other words, at every point in the space, there is a corresponding vector. Vector fields are used to describe various physical phenomena where vector quantities vary continuously across space. 


Vector fields

Overview

In tensor calculus, a vector field refers to the assignment of a vector to every point within a space, typically within Euclidean space. Visualizing a vector field on a plane involves picturing a series of arrows, each representing a vector with specific magnitudes and directions, anchored at individual points across the plane.

Fig 1 Visualization of vector fields on a sphere in 3D space


Let's start with an overview of vector fields as the basis of differential geometry [ref 4]. Consider a three-dimensional Euclidean space characterized by basis vectors {ei} and a vector field V, expressed as  {fi}  =(f, f2, f3 )  . 

Fig. 2 Visualization of a vector field in 3D Euclidean space

The vector field at the point P(x,y,z) is defined as the tuple (f1(x,y,z), f2(x,y,z), f3(x,y,z)). The vector over a field of n dimension field and basis vectors  {ei}  can be formally defined as: \[f: \boldsymbol{x} \,\, \epsilon \,\,\, \mathbb{V} \mapsto \mathbb{R}^{n} \\ f(\mathbf{x})=\sum_{i=1}^{n}{f^{i}}(\mathbf{x}).\mathbf{e}_{i} \ \ \ e_{i}=\frac{\partial }{\partial x^{i}}\]

Implementation

Example for 2 dimension space: \[f(x,y)=\frac{-y}{\sqrt{x^{2}+y^{2}}} \vec{i} + \frac{x}{\sqrt{x^{2}+y^{2}}} \vec{j} \ \ \ (1) \] Let's carry out the creation of this vector field, f defined in the formula (1) in SymPy and compute its value at f(1.0, 2.0). To begin, we need to establish a 2D coordinate system, denoted as cs, and then express the vector field as the sum of the two base scalar field f1 and f2.

import sympy
import math
from sympy import symbols
from sympy.diffgeom import Manifold, Patch, CoordSystem, BaseScalarField

x, y = symbols('x, y', real=True)
cs= CoordSystem('x y', Patch('P', Manifold('square', 2)))

norm = sympy.sqrt(x*x + y+y)
f1 = BaseScalarField(cs, 0)
f2 = BaseScalarField(cs, 1)
f = -f2/norm + f1/norm
w = f.evalf(subs={x: 1.0, y: 2.0})
print(w)


The visualization of this 2-dimension field is as follow:
  • Set up the mesh grid
  • Implement the vector field f
  • Display the vector field using the quiver method from Matplotlib module.

import matplotlib.pyplot as plt
import numpy as np

# Set up the mesh grid
grid_values = np.linspace(-8, 8, 16)
n_x, n_y = np.meshgrid(grid_values, grid_values)

# Define the vector field
np_norm = np.sqrt(n_x**2 + n_y**2)
X = -n_y/np_norm
Y = n_x/np_norm

# Display
plt.quiver(n_x, n_y, X, Y, color='red')
plt.show()


Fig. 3 Visualization of a vector field f(x,y) defined in formula (1)


Example for 3 dimension space: \[f(x,y,z) = (2x+z^{3})\boldsymbol{\mathbf{\overrightarrow{i}}} + (xy+e^{-y}-z^{2})\boldsymbol{\mathbf{\overrightarrow{j}}} + \frac{x^{3}}{y}\boldsymbol{\mathbf{\overrightarrow{k}}} \ \ \ (2) \]  Let's carry out the creation of this vector field, f, in SymPy and compute its value at f(1.0, 2.0, 0.5). To begin, we need to establish a 3D coordinate system, denoted as r, and then express the vector using r.

Note: Contrary to the example with a 2-dimension field which require to define explicitly the coordinate system, this 3D vector field leverage an existing 3D coordinate, CoordSys3D

from sympy.vector import CoordSys3D
from sympy import exp


r = CoordSys3D('r')

f = (2 * r.x + r.z ** 3) * r.i + (r.x * r.y + sympy.exp(-r.y) - r.z ** 2) * r.j + (r.x ** 3 / r.y) * r.k
w = f.evalf(subs={r.x: 1.0, r.y: 2.0, r.z: 0.2})    # 2.008*r.i + 2.09533528323661*r.j + 0.5*r.k
print(w)

The visualization of the 3-dimension vector field (2) is very similar to the visualization of the 2-dimension field (1).

# Set up a 8 x8 x8  mesh grid
grid_values = np.linspace(0.1, 0.9, 8)
n_x, n_y, n_z = np.meshgrid(grid_values, grid_values, grid_values)

# Implement the 3 components of vector field
#. f = Xi + yJ + Zj
X = 2*n_x+n_z**3
Y = n_x*n_y + np.exp(-n_y) - n_z**2
Z = n_x**3/n_y

# Display the vector field in 3D
fig = plt.figure()
ax = fig.add_subplot(projection='3d')
ax.quiver(n_x, n_y, n_z, X, Y, Z, length=0.2, color='blue', normalize=True)
plt.show()


Fig. 4 Visualization of a vector field f(x, y, z) defined in formula (2)


Covector fields

Covariant vectors (or tensors) are fundamental concepts in the field of tensor calculus and differential geometry, used to describe geometric and physical entities in a way that is independent of the coordinate system used. \[df: V\rightarrow \mathbb{R}\]
\[f^*: f\rightarrow  df=\sum_{i=1}^{n}\frac{\partial f}{\partial x^{i}}dx_{i}\] For a co-vector field (or differential form) along a vector v: \[df(\vec{v})=\triangledown f.\vec{v}\]

Let's consider a very simple vector field: \[f(x, y)=x\vec{i} + y\vec{j} \ \ \ (3) \] and co-vector field: \[dx=\frac{1}{n} \ \ dy=\frac{1}{n} \ \ \ n=1,\infty\]
The following code snippet illustrates the vector field and co-vector field for (3).

# Limit values for vector and covector fields
_min = -8
_max = 8

fig, ax = plt.subplots()

# Generate co-vector fields
co_vectors = [{'center': (0.0, 0.0), 'radius': _max*(1.0 - 1.0/n), 'color': 'blue', 'fill': False}
       for n in range(1, 10)]
[plt.gca().add_patch(Circle(circle['center'], circle['radius'], color=circle['color'], fill=circle['fill']))
       for circle in co_vectors]

# Set limits for x and y axes
ax.set_aspect('equal')
ax.set_xlim(_min, _max)
ax.set_ylim(_min, _max)
        
# Set up the grid
grid_values = np.linspace(_min, _max, _max-_min)
x, y = np.meshgrid(grid_values, grid_values)
        
# Display vector and co-vector fields
plt.quiver(x, y, x, y, color='red')
plt.show()


The vector field is represented by red arrows while the co-vector fields is represented by the blue circle (levels set).

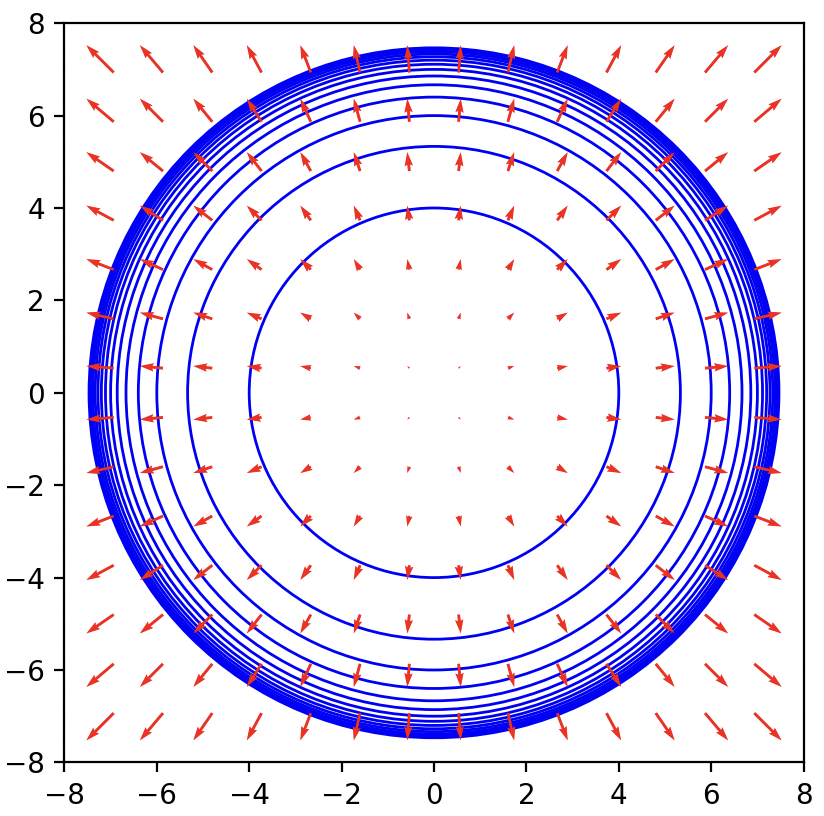
Fig. 5 Visualization of a vector field and co-vector field for f(x, y) = (x, y) 


As depicted in the plot above, vector fields exhibit contravariant behavior, meaning that the field's intensity (represented by arrow size) amplifies as we move away from the origin. Conversely, covector fields demonstrate covariant behavior, resulting in a decrease in the spacing between the field's level sets as we move away from the origin.

References

[3Vector and Tensor Analysis with Applications -  A. I. Borisenko, I. E. Tarapov - Dover Books on MathenaticsPublications 1979 
[4A Student's Guide to Vectors and Tensors - D. Fleisch - Cambridge University Press - 2008


-------------
Patrick Nicolas has over 25 years of experience in software and data engineering, architecture design and end-to-end deployment and support with extensive knowledge in machine learning. 
He has been director of data engineering at Aideo Technologies since 2017 and he is the author of "Scala for Machine Learning", Packt Publishing ISBN 978-1-78712-238-3


Monday, March 25, 2024

Geometric Learning in Python: Intrinsic representation

Target audience: Intermediate
Estimated reading time: 7'

Tensors and vectors, which depend on coordinate systems, can be perplexing even for seasoned practitioners. The third installment of our Geometric Learning in Python series addresses intrinsic and extrinsic coordinate systems, including a transformation from cartesian to polar coordinates.

Table of contents
        Covariant vectors
Follow me on LinkedIn


What you will learn: How to apply coordinates system and leverage intrinsic and extrinsic geometry.

Notes:
  • Environment: Python 3.11, Numpy 1.26.4, Geomstats 2.7.0, Matplotlib 3.8.2
  • This article is a follow up to Geometric Learning in Python: Manifolds
  • Source code available at Github.com/patnicolas/Data_Exploration/manifolds
  • To enhance the readability of the algorithm implementations, we have omitted non-essential code elements like error checking, comments, exceptions, validation of class and method arguments, scoping qualifiers, and import statements.

Introduction

In geometry, a coordinate system employs one or more numerical values, known as coordinates, to uniquely identify the location of points or other geometric entities within a manifold, like Euclidean space.

This article is the 3rd installment in our series on Geometric Learning in Python following
  1. Geometric Learning in Python: Basics introduces differential geometry as a applied to machine learning and its basic components.
  2. Geometric Learning in Python: Manifolds describes manifold components such as tangent vectors, geodesics with implementation in Python for Hypersphere using the Geomstats library.

This article does not offer a formal explanation of vectors, tensors, or coordinate systems. Readers are strongly recommended to seek out tutorials [ref 1], video series [ref 2], or publications [ref 3, 4] for more detailed information.

Note: Classes ManifoldPoint and HypersphereSpace have been introduced in the previous article [ref 5]

Covariance and contravariance

Contravariant and covariant vectors (or tensors) are fundamental concepts in the field of tensor calculus and differential geometry, used to describe geometric and physical entities in a way that is independent of the coordinate system used.

NoteThis section provides a summary of the essential aspects of covariant and contravariant vectors. Readers are highly encouraged to refer to relevant tutorials [ref 6] for a more comprehensive understanding.

Contravariant vectors

Contravariant vectors, also known as tangent vectors, are vectors that transform in the same way as the coordinate system's axes. When the coordinate system is stretched or compressed, the components of a contravariant vector change in the same direction.
If the coordinate system is changed, the components of a contravariant vector transform inversely to the coordinates themselves.
A contravariant vector v is defined by its components vi and its basis vectors e:
\[\vec{v}=\sum_{i=1}^{n} v^{i} \vec{e}_{i}\]Contravariant vectors can be thought of as "pointing" in a certain direction in space, defining directions along which scalar quantities increase.

Covariant vectors

Covariant vectors, or dual vectors, are vectors whose components transform oppositely to the coordinate system's transformation. This means when the coordinate system is stretched, the components of a covariant vector are compressed, and vice versa.
The components of a covariant vector transform in the same way as the coordinate differentials, meaning they scale directly with changes in the coordinate grid.

Covariant vectors are often interpreted as describing surfaces or gradients that interact with other vectors to produce scalar quantities, like the dot product.\[\begin{matrix} \omega : \vec{v} \rightarrow < \ ,\vec{v}>\\ \omega(\vec{v} ) = <\vec{\omega}, \vec{v} > = \omega.v^{T} \end{matrix}\]

Intrinsic vs extrinsic geometries

Intrinsic coordinates

Intrinsic geometry involves studying objects, such as vectors, based on coordinates (or base vectors) intrinsic to the manifold's point. For example, analyzing a two-dimensional vector on a three-dimensional sphere using the sphere's own coordinates.
Intrinsic geometry is crucial in differential geometry because it allows the study of geometric objects as entities in their own right, independent of the surrounding space. This concept is pivotal in understanding complex geometric structures, such as those encountered in general relativity and manifold theory, where the internal geometry defines the fundamental properties of the space.

Here are key points:
  • Internal Measurements: Intrinsic geometry involves measurements like distances, angles, and curvatures that are internal to the manifold or surface. 
  • Coordinate Independence: Intrinsic coordinates describe points on a geometric object using a coordinate system that is defined on the object itself, rather than in the ambient space. 
  • Curvature: A fundamental concept in intrinsic geometry is curvature, which describes how a geometric object bends or deviates from being flat. The curvature is intrinsic if it is defined purely by the geometry of the object and not by how it is embedded in a higher-dimensional space.
Fig 1. Visualization of intrinsic coordinates of manifold in 3-dimension Euclidean space


Extrinsic coordinates

Extrinsic geometry studies objects relative to the ambient Euclidean space in which the manifold is situated, such as viewing a vector on a sphere's surface in three-dimensional space.

Extrinsic geometry in differential geometry deals with the properties of a geometric object that depend on its specific positioning and orientation in a higher-dimensional space. It is concerned with how the object is embedded in this surrounding space and how it interacts with the ambient geometry. It contrasts with intrinsic geometry, where the focus is on properties that are independent of the ambient space, considering only the geometry contained within the object itself. Extrinsic analysis is crucial for understanding how geometric objects behave and interact in larger spaces, such as in the study of embeddings, gravitational fields in physics, or complex shapes in computer graphics.

Here’s what extrinsic geometry involves:
  • Embedding: Extrinsic geometry examines how a lower-dimensional object, like a surface or curve, is situated within a higher-dimensional space. 
  • Extrinsic Coordinates: These are coordinates that describe the position of points on the geometric object in the context of the larger space.
  • Normal Vectors: An important concept in extrinsic geometry is the normal vector, which is perpendicular to the surface at a given point. These vectors help in defining and analyzing the object's orientation and curvature relative to the surrounding space.
  • Curvature: Extrinsic curvature measures how a surface bends within the larger space. 
  • Projection and Shadow: Extrinsic geometry also looks at how the object projects onto other surfaces or how its shadow appears in the ambient space.
Fig. 2 Visualization of extrinsic in 3-dimension Euclidean space


Implementation

Manifold and coordinates system

We will illustrate the various coordinates on the hypersphere space we introduced in a previous article Geometric Learning in Python: Manifolds
The structure of data points on a manifold is defined by the class ManifoldPoint described in a previous post ManifoldPoint definition

@dataclass
class ManifoldPoint:
id: AnyStr
location: np.array
tgt_vector: Optional[List[float]] = None
geodesic: Optional[bool] = False
intrinsic: Optional[bool] = False
def to_intrinsic(self, space: LevelSet) -> np.array:
return space.extrinsic_to_intrinsic_coords(self.location) if not self.intrinsic else self.location
def to_extrinsic(self, space: LevelSet) -> np.array:
return space.intrinsic_to_extrinsic_coords(self.location) if self.intrinsic else self.location

def to_intrinsic_polar(self, space: LevelSet) -> np.array:
intrinsic_coordinates = self.to_intrinsic(space)
return ManifoldPoint.__cartesian_to_polar(intrinsic_coordinates)

The class ManifoldPoint has 3 methods to define its location given a coordinate system:
  • to_intrinsic: Convert the current location from extrinsic cartesian coordinates (3 dimension) to intrinsic cartesian coordinates (2 dimension) if the flag intrinsic is False
  • to_extrinsic: Convert the location from intrinsic cartesian coordinates to extrinsic coordinates if the flag intrinsic is True
  • to_intrinsic_polarConvert the current location from extrinsic cartesian coordinates (3 dimension) to intrinsic polar coordinates (2 dimension) if the flag intrinsic is False
This last method relies on the transformation from Cartesian to Polar coordinate on the tangent plane.

The following figure illustrates the transformation from cartesian coordinates (x, y) to polar coordinates (r, theta)


Fig. 3 Visualization of polar coordinates on 2 dimension surface

Here are the mathematical equations for the transformation from cartesian to polar coordinates.\[\begin{matrix} r=\sqrt{x^{2}+y^{2}}\ \ \ \ x.y > 0\\ \theta = arccos(\frac{x}{r})\ \ if\ y >= 0 \ \ \ -arccos(\frac{x}{r}))\ \ \ if\ y <0 \end{matrix}\]
The following  private static method  __cartesian_to_polar , which executes the two formulas, is straightforward.

def __cartesian_to_polar(cartesian_coordinates: np.array) -> np.array:
x = cartesian_coordinates[0]
y = cartesian_coordinates[1]
# Compute rho, theta from x, y
r = math.sqrt(x ** 2 + y ** 2) // First equation
theta = math.acos(x / r) if y >= 0.0 else -math.acos(x / r) // Second equation
return np.array([r, theta])

Next, we will explore how to calculate the mean of multiple points on a manifold, both in Euclidean space and along the geodesic of the manifold in extrinsic coordinates.

Euclidean and Fréchet means

Let's explore how to compute means from the perspective of the extrinsic geometry considering a surface that is embedded in a three-dimensional Euclidean space.


Fig. 4 Visualization of Euclidean mean (extrinsic) and Fréchet mean (intrinsic)


First let's compute the mean of multiple point in the default Euclidean space using comprehensive list and Numpy mean functions

def euclidean_mean(manifold_points: List[ManifoldPoint]) -> np.array:
return np.mean([manifold_pt.location for manifold_pt in manifold_points], axis=0)

Next we compute the intrinsic mean or Fréchet mean using Geomstats class FrechetMean.

def frechet_mean(self, manifold_pt1: ManifoldPoint, manifold_pt2: ManifoldPoint) -> np.array:
from geomstats.learning.frechet_mean import FrechetMean
frechet_mean = FrechetMean(self.space)
x = np.stack((manifold_pt1.location, manifold_pt2.location), axis=0)
frechet_mean.fit(x)
return frechet_mean.estimate_


Similar to the prior article on Manifolds [ref 7] in this series, we utilize the Hypersphere as our evaluation manifold. In the ensuing implementation, we generate two random points on a Hypersphere, calculate the Euclidean and Fréchet means, and then depict the outcomes using the Matplotlib library.

The execution confirms that euclidean mean does not belong to the manifold (as with fig 4) while the Fréchet mean do.

Note: The HypersphereSpace class, introduced in the previous article [ref 7], encapsulates the essential methods for manipulating the Hypersphere function defined in the Geomstats library.

manifold = HypersphereSpace(True)
samples = manifold.sample(2)
assert(manifold.belongs(samples[0])) # Is True
# 1. Generate points on the Hyperphere
vector = [0.8, 0.4, 0.7]
manifold_points = [
ManifoldPoint(id=f'data{index}', location=sample, tgt_vector=vector, geodesic=False)
for index, sample in enumerate(samples)
]
# 2. Compute mean of two points on the Euclidean space
euclidean_mean = manifold.euclidean_mean(manifold_points)
assert(manifold.belongs(euclidean_mean)) # Is False
# 3. Compute the mean on the manifold geodesics
frechet_mean = manifold.frechet_mean(manifold_points[0], manifold_points[1])
print(f'Euclidean mean: {euclidean_mean}\nFrechet mean: {frechet_mean}')
assert (manifold.belongs(frechet_mean)) # Is True
# 4. Visualize various data points on the Hypersphere
frechet_pt = ManifoldPoint(id='Frechet mean',location=frechet_mean, tgt_vector=None,geodesic=False)
manifold_points.append(frechet_pt)
manifold.show_manifold(manifold_points, [euclidean_mean])


Output:
Euclidean mean: [ 0.52305713,  -0.39238391,  -0.10012601]
Fréchet mean: [ 0.79071656, -0.59317508, -0.15136262]

The method show_manifold [ref 8] is called to display the two original points, data0 and data1, on the hypersphere, along with the Fréchet and Euclidean means. It becomes clear that the Euclidean mean does not reside on the hypersphere.
Fig. 5 Illustration of Fréchet and Euclidean mean on a Hypersphere


Intrinsic cartesian coordinates

In the previous article, we explored tangent space and tangent vectors [ref 9] for the hypersphere using extrinsic coordinates. The figure below demonstrates the tangent space, showing both the Euclidean cartesian coordinates X, Y, Z, and the intrinsic cartesian coordinates x, y.
Fig. 6 Visualization of intrinsic cartesian coordinates on a hypersphere


The method extrinsic_to_intrinsic transforms the position of a list of points on the hypersphere from extrinsic cartesian coordinates to intrinsic coordinates. Conversely, the method intrinsic_to_extrinsic changes their location from intrinsic cartesian coordinates to extrinsic coordinates.

def extrinsic_to_intrinsic(self, manifold_pts: List[ManifoldPoint]) -> List[ManifoldPoint]:
return [ManifoldPoint(
id=pt.id,
location=pt.to_intrinsic(self.space),
tgt_vector=pt.tgt_vector,
geodesic=pt.geodesic,
intrinsic=True) for pt in manifold_pts]

def intrinsic_to_extrinsic(self, manifold_pts: List[ManifoldPoint]) -> List[ManifoldPoint]:
return [ManifoldPoint(
id=pt.id,
location=pt.to_extrinsic(self.space),
tgt_vector=pt.tgt_vector,
geodesic=pt.geodesic,
intrinsic=False) for pt in manifold_pts]


The code snippet below transforms two randomly chosen points on the hypersphere from extrinsic coordinates (3-dimensional) to intrinsic coordinates (2-dimensional) and then back to extrinsic coordinates.

intrinsic = False
manifold = HypersphereSpace(True, intrinsic)
# Create Manifold points with default extrinsic coordinates
random_samples = manifold.sample(2)
manifold_pts = [
ManifoldPoint(f'id{index}', value, None, False, intrinsic)
for index, value in enumerate(random_samples)
]
print(f'Extrinsic coordinates:\n{[m_pt.location for m_pt in manifold_pts]}')
intrinsic_pts = manifold.extrinsic_to_intrinsic(manifold_pts)
print(f'Intrinsic coordinates:\n{[m_pt.location for m_pt in intrinsic_pts]}' )

extrinsic_manifold_pts = manifold.intrinsic_to_extrinsic(intrinsic_manifold_pts)
print(f'Regenerated extrinsic coordinates:\n{[m_pt.location for m_pt in extrinsic_manifold_pts]}')


Output:
Extrinsic coordinates:
[[-0.53207445, -0.68768687,  0.49394691], 
 [-0.45305036, -0.1875893 , -0.87152489]]
Intrinsic Coordinates:
[[1.05417307, 4.05388149], 
 [2.62909989, 3.53415928)]
Regenerated extrinsic coordinates:
[[-0.53207445, -0.68768687,  0.49394691], 
[-0.45305036, -0.1875893 , -0.87152489]]

As expected the final output of the coordinates of the two points matches the original extrinsic coordinates.

Intrinsic polar coordinates

The figure below demonstrates the tangent space, showing both the Euclidean cartesian coordinates XYZ, and the intrinsic cartesian coordinates rtheta.
Fig. 7 Visualization of intrinsic polar coordinates on a hypersphere

The extrinsic_to_intrinsic_polar method functions similarly to extrinsic_to_intrinsic for cartesian coordinates. It changes the location of a set of points on the hypersphere from extrinsic cartesian coordinates to intrinsic polar coordinates.

def extrinsic_to_intrinsic_polar(self, manifold_pts: List[ManifoldPoint]) -> List[ManifoldPoint]:
return [ManifoldPoint(
id=pt.id,
location=pt.to_intrinsic_polar(self.space),
tgt_vector=pt.tgt_vector,
geodesic=pt.geodesic,
intrinsic=False) for pt in manifold_pts]

Output:
To extrinsic: [0.25934338  0.14167993  0.95533649]
To intrinsic: [2.09057978  3.26478145]
To polar: [3.16428762  0.64002724]

References

[3] Vector and Tensor Analysis with Applications -  A. I. Borisenko, I. E. Tarapov - Dover Books on MathenaticsPublications 1979 
[4A Student's Guide to Vectors and Tensors - D. Fleisch - Cambridge University Press - 2008


-------------
Patrick Nicolas has over 25 years of experience in software and data engineering, architecture design and end-to-end deployment and support with extensive knowledge in machine learning. 
He has been director of data engineering at Aideo Technologies since 2017 and he is the author of "Scala for Machine Learning", Packt Publishing ISBN 978-1-78712-238-3